Jen Arriaza

Sr. Data Scientist | Machine Learning Engineer
ML/AI Ops + Industrial Analytics
 NYC Metro
I build ML/AI tools for complex industrial applications and operational intelligence.
Contact
Analytics Engineering
Time-series Analysis with NYC OpenData - Waste & Refuse Trends
Concept: In this project, I looked at historical waste and refuse data in NYC from the year 1990 through 2017. The process begins with some exploratory data analysis, then interactive visualizations. Data-preprocessing was done with Pandas, exploratory data analysis with Scipy, visualizations with Seaborn, and interactive visualizations wtih Plotly.
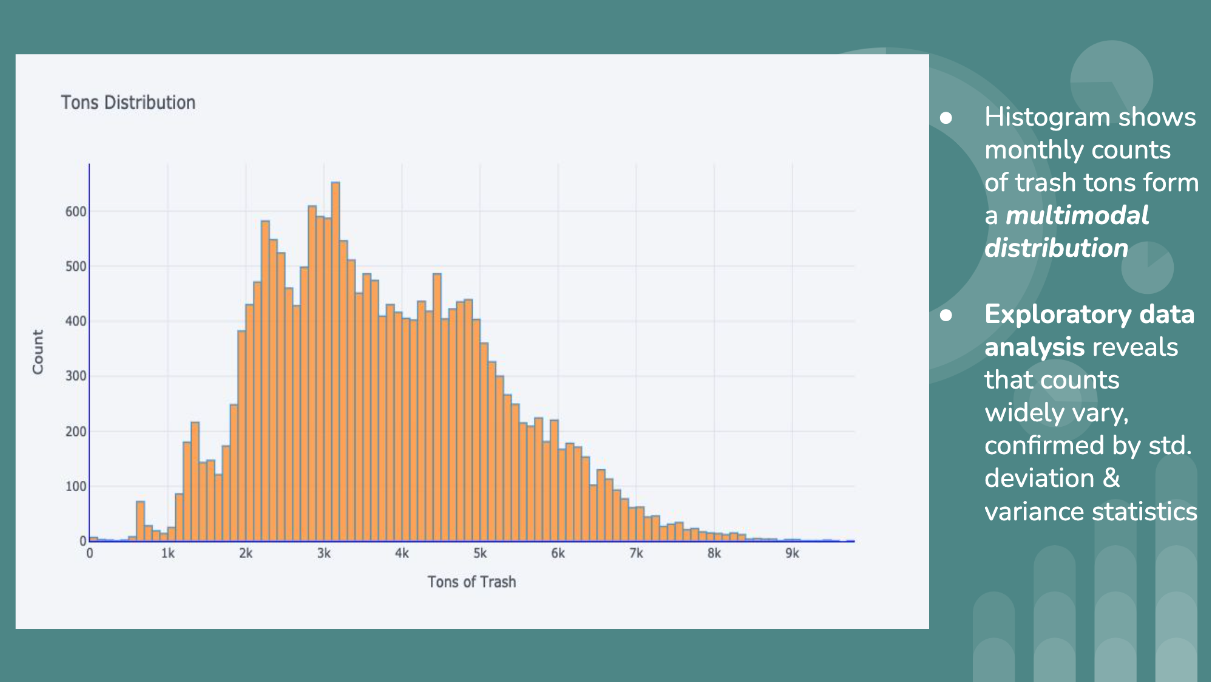
Data: The data is found on NYC OpenData and includes over 21,000 records representing monthly waste totals in the boroughs. Each row represented a monthly total for each borough, split into waste/refuse/recycling categories. Brooklyn and Queens account for the highest collection of trash tons historically. Trash and refuse tons collected shows progress towards declining, but very slowly. Trash tonnage decreases significantly in January and February, increases June and July. Slight uptick in the year 2010 where NYC saw a population–new residents likely followed current resident behavior, and slow gradual decline of waste continues.
